
Part four of a four-part series on successful immunofluorescence. Read Part 1: The Importance of Validation, Part 2: Fixation and Permeabilization, and Part 3: Experimental Controls.
—
After your samples have been prepared, it's time to incubate them with a well-validated antibody, the workhorse of immunofluorescence. If you are a seasoned pro at IF experiments, you are probably used to checking the antibody datasheet (or web page) for the recommended dilution. But have you ever wondered where those recommendations come from?
Primary Antibody Titration
CST scientists routinely perform titrations using positive and negative cell lines to provide you with the recommended dilution that gives optimal signal with minimal background staining. By comparing the "signal" of fluorescence intensities in cells that express the target of interest— the positive mean fluorescence intensity, MFI(+)—against the background noise of cells that lack expression—the negative mean fluorescence intensity, MFI(-)—the signal-to-noise ratio (S/N) can be calculated.
An example of an antibody titration is shown below using an antibody to Mucin-1 (MUC-1), with the optimal concentration/recommended dilution outlined in red. ZR-75-1 cells that express Mucin-1 are shown in the top row, and HCT 116 cells that do not express Mucin-1 are in the lower row. The optimal antibody dilution (outlined in red) has a high signal in the ZR-75-1 cells, and does not exhibit much background (in other words, noise) in the HCT 116 cells.
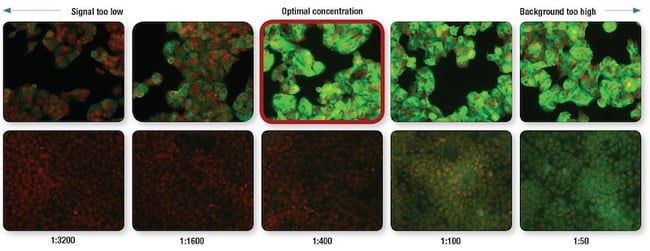
Optimization of MUC1 (D9O8K) XP Rabbit mAb #14161 dilution for IF analysis. IF analysis of ZR-75-1 cells (MUC1-positive, upper) and HCT 116 cells (MUC-1-negative, lower) using #14161 (green) at the indicated dilutions. Red = Propidium Iodide (PI)/RNase Staining Solution #4087.
The MFI(+) from ZR-75-1 cells, MFI(-) from HCT 116 cells, and the S/N calculated by dividing MFI(+) by MFI(-) are plotted in the graph below:
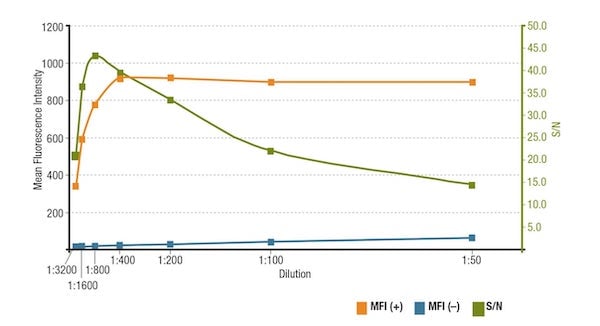
Analysis of S/N for MUC1 (D9O8K) XP Rabbit mAb #14161 dilution. Quantitation of the Mean Fluorescence Intensity in expressing (MFI(+), orange) ZR-75-1 cells and non-expressing (MFI(-), blue) HCT 116 cells, and calculated S/N (green).
If the antibody is applied at too low of a concentration, the fluorescence signal will be too dim to distinguish from background noise. On the other hand, an excessively high concentration will contribute to background staining, decreasing S/N. Always check the product datasheet for the recommended dilution.
[Video] Three Questions to Ask Before Your Next IF Assay
Can't see the above video?
Primary Antibody Incubation Conditions: Time and Temperature
All of our recommended primary antibody dilutions are based on overnight incubation at 4°C. This does not necessarily mean that CST antibodies won't work with a shorter incubation period, which is often used for automated platforms. The concentration of primary antibody may be increased to compensate for shorter incubation times; however, this will increase costs.
Temperature is another variable to consider. The following experiment illustrates the dependence of signal intensity on both incubation time and temperature.
Mesenchymal SNB19 cells express the intermediate filament protein vimentin but not the adhesion protein E-cadherin, while epithelial HT-29 cells express E-Cadherin but not vimentin. An analysis of both cell lines was carried out using Vimentin (D21H3) XP Rabbit mAb #5741 and E-Cadherin (24E10) Rabbit mAb #3195, using each antibody at its recommended dilution and varying the temperature and duration of primary antibody incubation.
Examination of the signal intensity of imentin (D21H3) XP Rabbit mAb #5741 in vimentin-positive SNB-19 cells shows optimal signal levels at the recommended incubation conditions of 4°C/overnight (O/N), while shorter incubation times at higher temperatures yield signal that is significantly lower. Vimentin-negative HT-29 cells incubated with the same antibody O/N are shown for comparison.
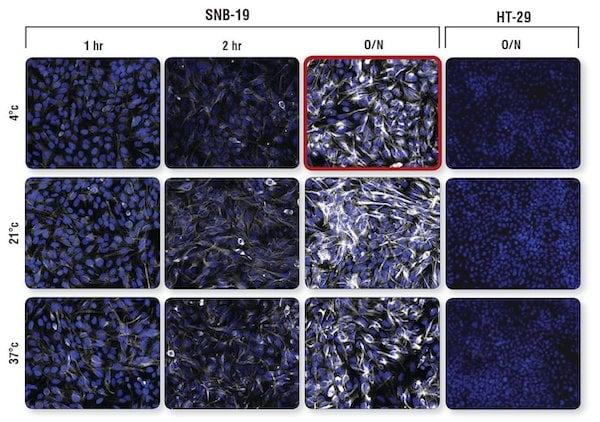
Confocal IF analysis of vimentin-positive SNB-19 cells and vimentin-negative HT-29 cells using Vimentin (D21H3) XP® Rabbit mAb #5741 (white). Incubation of primary antibody at its recommended dilution was performed at 4°C, 21°C, or 37°C for 1 hr, 2 hr, or overnight (O/N). Conditions recommended by CST for primary incubation (4°C O/N) yield maximum signal with little background (outlined in red). Blue = Hoechst 33342 #4082 (fluorescent DNA dye).
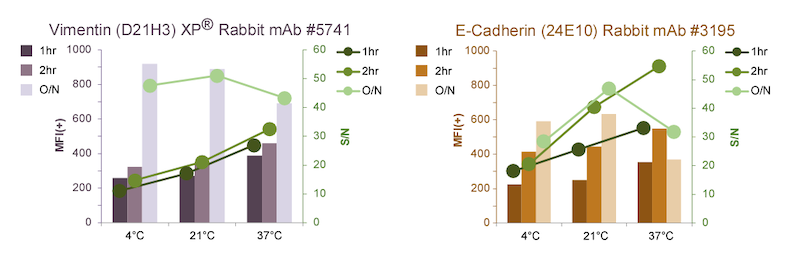
Quantification of Vimentin (D21H3) XP Rabbit mAb #5741 signal levels in Vimentin-positive cells using a high-throughput laser scanning imaging cytometer shows that the MFI(+) increases with O/N incubation (below, left ). For one- or two-hour incubations, increasing temperature correlates with increasing MFI(+) and S/N , but not enough to match the O/N incubation.
For E-cadherin (24E10) Rabbit mAb #3195, MFI(+) and S/N increase in O/N incubations at either 4ºC or 21ºC (below, right), although not as pronounced as for #5741. Interestingly, in O/N incubations, elevated temperature (37ºC) actually results in lowered MFI(+) and S/N, potentially due to loss of epitope and/or antibody binding. This phenomenon is not observed for the vimentin antibody, likely due to the higher stability of vimentin intermediate filaments. Although the highest S/N for #3195 is observed at higher temperatures, the MFI(+) at 4ºC O/N is close to optimal, and S/N is reasonable.
Not every antibody will have the same response to varying temperatures and incubation lengths. For scientists who are interested in shorter incubations (for example, someone who will be running high-throughput analysis of many samples), performing this type of optimization can be informative. Careful consideration should be given to target abundance and antibody stability when abbreviating the incubation time or modifying the temperature.
Best Practices for Successful Immunofluorescence Experiments
Thanks for checking out the Successful Immunofluorescence posts. For more, use the link below to download the Guide to Successful Immunofluorescence, a resource packed with tips and the nine-step Protocol for a successful immunofluorescence experiment.

Additional Resources:
For more tips for achieving successful immunofluorescence, check out the blogs below:
- 5 Steps to Publication-Worthy IF Images
- 3 Questions to ask before starting your IF experiment
- Fluorescent Staining Using Multiple Antibodies
Read the complete Successful Immunofluorescence Series:
- Part 1: Successful Immunofluorescence: The Importance of Validation
- Part 2: Successful Immunofluorescence: Experimental Controls
- Part 3: Successful Immunofluorescence: Fixation and Permeabilization
- Part 4: Successful Immunofluorescence: Antibody Dilution and Incubation Conditions