
There are several situations in the lab where you’ll need to know the number of cells in a given volume. Here are a few that apply to the use of animal or human cell lines and primary samples:
- Setting up a transfection reaction with plasmid DNA, or siRNA- or CRISPR-mediated knockdown
- Monitoring proliferation and viability of cultured cell lines
- Seeding the appropriate number of cells into new vessels when splitting cells
- Clinical lab uses, such as a red blood cell count
Ensuring accuracy is the primary concern when counting cells. In this post, we will explore the variables that influence the accuracy of your cell count, whether you’re counting your cells manually or with an automated cell counter.
Video: Splitting Cells: Why It's Important and 3 Essential Tips
Cell Counting Methods and the Importance of Representative Sampling
Cell counts can be performed either manually or using automated methods. Automated cell counters can be a time saver compared to manually counting cells, which is typically performed using a specialized chamber called a hemocytometer and a light microscope. But whichever method is available to you, employing proper sampling will help ensure your cell count is accurate.
Researchers typically remove a small-volume sample (~10-50 μl) from the cell culture vessel using sterile technique, perform the cell count on the sample, and then dispose of the sample. This is done to maintain sterility of the propagating cell line. As anybody who has taken an introductory course in statistics will recall, the accuracy of any sampling-based measurement is dependent on the sample population being representative of the main population. For measuring cells, this means the cells need to be a homogenous, single-cell suspension without clumps or doublets before sampling. Adherent cell lines will need to be fully dissociated using trypsin or other dissociation methods. You may want to “pre-sample” and visualize your cells using a microscope to verify you have a single-cell suspension with minimal clumps or cell doubles before starting the cell count.
In the absence of shaking, suspension cell lines will collect at the bottom of the vessel. Therefore, both adherent and suspension cell lines should be re-suspended by carefully pipetting the suspension volume up and down a few times immediately before removing a small volume for sampling. This helps ensure a representative sample and improves the accuracy of your cell count.
Using an Automated Cell Counter
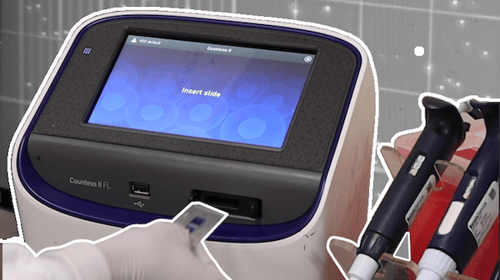
Automated cell counters are available from a number of manufacturers based on a few different evolving technologies2, 3 and have become more common in cell culture facilities over the years. Some counters have a reusable sample chamber that needs to be cleaned between uses, and others use disposable chambers or slides. Some instruments use electrical impedance to count cells, and others use an imaging-based approach that may also offer features such as viability or phenotypic measurements using fluorescent or colorimetric dyes. For example, trypan blue is commonly used to assess viability in manual counting (see the section below on trypan blue) and many automated systems are compatible with the negatively charged dye.
The footprint (size), complexity, capabilities, and cost of cell counters also vary widely. If you're using an automated cell counter, get familiar with the manufacturer’s instructions on how to prepare samples, what volume to load, any special requirements for your cell type, and any software or instrument settings (such as imaging focus and exposure) that need to be optimized.
Using a Hemocytometer
If an automated system is not available in your facility, manual cell counting can be performed using a reusable or disposable hemocytometer, which has two chambers etched with grids. The cell suspension is drawn into the chambers by capillary action between the grid and the coverglass, forming a thin layer. The precise measurements of the grid and the height of the chamber provide a known volume and enable the calculation of cell density.
NOTE: A hemocytometer coverglass is slightly thicker and has a different shape than the type of glass coverslips used for immunohistochemistry and immunocytochemistry assays.
If using a reusable hemocytometer, make sure to keep the hemocytometer and the coverglass clean, and handle them carefully because they can easily break if accidentally dropped. Before using, wipe the hemocytometer and the coverglass with lens paper to remove dust and particles that could interfere with the cell count, and align the coverslip over the chamber.
The typical grid pattern for eukaryotic cell culture is the Neubauer chamber (Figure 1). The hemocytometer has two sides, each with a 3x3 grid of major squares. Each major square is 1 mm x 1 mm, and the height of the chamber is 0.1 mm, so the fluid volume above each square is 0.1 μL. A low-magnification microscope (usually 10x) objective lens will allow one of the squares to be positioned in the field of view.
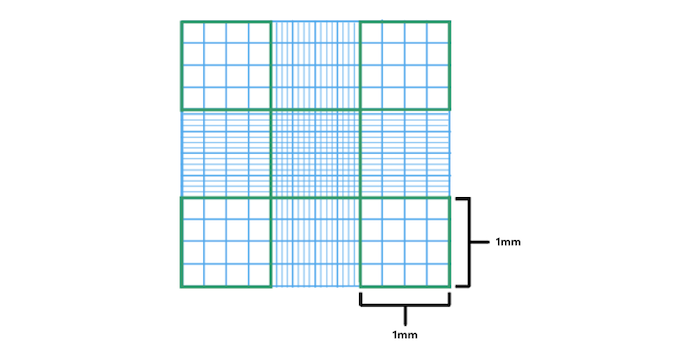
Figure 1. Each side of a two-sided hemocytometer is etched with nine major (1 mm) squares, and each square corresponds to a 0.1 μl volume. For most cell lines, count in the corner squares, but smaller cells such as red blood cells may be counted in the center square using a higher magnification.
To manually count the cells, it’s useful to have a mechanical or digital tally counter. If you will be performing live/dead cell counts (Figure 2), a differential counter with two (or more) keys can also be helpful because you can count multiple populations simultaneously.
 Figure 2. A simple tally counter (left) and a differential, two-key counter (right).
Hemocytometer Cell Counting: Time to Count!
To being, align the coverslip on the hemocytometer and load the recommended volume of unlabeled or trypan blue-labeled suspension using a pipette. You should see the meniscus of the fluid go all the way past the grid on each side but do not over-fill. Too much fluid changes the height/volume inside the chamber and can lead to erroneous counts.
Start in one of the corner squares, which is subdivided into a 4x4 grid of 16 smaller squares. Using the hand tally counter, count the cells in one of the smaller squares, and proceed in a pattern (such as top row, left to right, move one row down, left to right, etc.) to count cells in all 16 squares. To avoid double-counting, set a rule such as “DO count cells touching the border at the right or bottom of a small square, but DO NOT count cells touching the border at the left or top border of a small square,” and follow it consistently in every square (Figure 3).
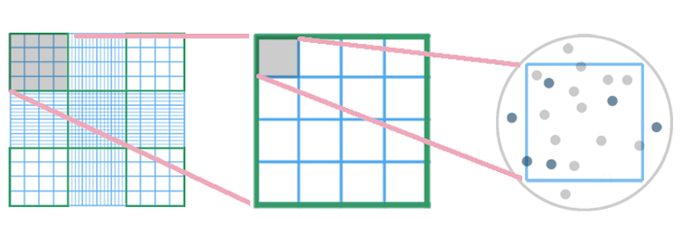
Figure 3. One of the 1 mm major squares (circled in the left panel) is magnified in the center panel. The top left small square is further magnified with cells illustrated on the right. In this example, we have set a rule to count live and dead cells inside the small square, as well as those touching the right and bottom borders, but to exclude cells touching the left and top borders. Therefore, the correct count in this simplified illustration is 10 live cells and three dead cells.
Count one major (1 mm) square at a time. If using trypan blue (see the section below on trypan blue) and a simple tally counter, count the unstained live cells first, record the total, then reset the counter and count the blue (dead) cells, again recording the total before moving to the next major square. If using a two-key counter, you can use that to tally live cells in one channel and dead cells in the other channel as you go. Either way, write down the total for each major square, reset your counter, and move on to the next square. When finished, calculate the average number of live cells per major square and the average number of dead cells per major square.
A common approach is to count cells in the four major (1 mm) corner squares on one side of the hemocytometer, but you could also count eight major squares (from both sides of the hemocytometer) or any number of major squares. If the cell density is on the higher side, try using a smaller number of squares, or if it’s lower, use more squares to establish an accurate average. If the density is so high that you are having to count many hundreds of cells, try diluting the suspension further, cleaning the hemocytometer, and performing another count.
Cell Viability: Distinguishing Live vs Dead Cells with Trypan Blue
Counting populations of live vs dead cells is often performed to assess cell viability. It’s also a good practice to keep track of the percent viability over time, in case something is wrong with your cultures that could also potentially affect your experimental results. A routinely used method for viability measurement is trypan blue exclusion. Live cells with intact membranes will exclude trypan blue dye from entering the cells, and will appear clear/unstained. Dead and dying cells with ruptured cell membranes will allow trypan blue to enter the cytoplasm and will appear blue.
Trypan blue is available from various sources. Refer to the manufacturer’s instructions on how much dye solution to combine with your cell samples, and how long to incubate before measuring viability (with automated or manual methods). In the cell culture room at CST, we add 10 μl of 0.4% trypan blue to 10 μl of cell samples before counting. Take note of the dilution factor because this will be needed to back-calculate the original density of cells in the sample.
NOTE: Trypan blue labeling can also be used to assess cell permeabilization, rather than viability. For example, in the CST CUT&RUN protocol, trypan blue staining is used to confirm the cells are sufficiently permeabilized so that reagents such as antibodies and enzymes will be able to access and bind to chromatin inside the nucleus.
How to Calculate Cell Density
To calculate the cell density in cells/mL, take the average cell count per major square and multiply by 104 (remember, the volume of one major square is 0.1 μL, or 0.0001 mL = 1x10⁻⁴ mL), then multiply that by the dilution factor.
As an example, let’s say we counted eight major squares and recorded the totals below:
| Square | Live Cells | Dead Cells |
| 1 | 58 | 2 |
| 2 | 61 | 3 |
| 3 | 68 | 4 |
| 4 | 61 | 3 |
| 5 | 77 | 2 |
| 6 | 55 | 3 |
| 7 | 66 | 2 |
| 8 | 49 | 1 |
| Total | 495 | 20 |
To calculate the average number of live cells per square:
495 cells ÷ 8 squares = 61.875 cells per square
Next, multiply this number by 104 and then by five, since in this example, the cells were diluted 1:5 when labeling with trypan blue:
61.857 cells x 104 x 5 = 309.375 x 10⁴ cells/ml = 3.094 x 10⁶ cells/ml (rounded up)
This is the viable cell density. If seeding fresh plates, use this number to calculate the volume needed to seed the recommended number of cells per area of cell culture dish.
How to Calculate Percent Viability
To calculate the viability, first add the live and dead cells to get the total number of cells (535). Then divide the live cells by the total number of cells to get the percent viability:
495 ÷ 515 = 0.961 = 96.1%
Depending on the cell line and the method of splitting, the baseline viability may be higher or lower. It’s a good idea to write down the viability in a lab notebook or cell culture log so that you can monitor the viability of your cells over time.
When finished counting, remove the coverglass and spray or squeeze a stream of 70% ethanol on the hemocytometer and coverglass to kill the cells, then wipe clean. Rinse the hemocytometer and coverglass in DI H20, and wipe dry. Wipe one more time with lens paper, then wrap the hemocytometer and coverglass in the lens paper, and store them in the case or box.
Select References
- Stevenson K, McVey AF, Clark IBN, Swain PS, Pilizota T. General calibration of microbial growth in microplate readers. Sci Rep. 2016;6:38828. Published 2016 Dec 13. doi:10.1038/srep38828
-
Smith C. Counting cells by manual and automated methods. Biocompare. https://www.biocompare.com/Editorial-Articles/593111-Counting-Cells-by-Manual-and-Automated-Methods/. Published January 3, 2023. Accessed April 25, 2023.
-
Easthope E. Accurate cell counting. Biocompare. https://www.biocompare.com/Editorial-Articles/347331-Accurate-Cell-Counting/. Published March 14, 2018. Accessed April 25, 2023.
23-FLE-18100