


No one doubts that multiplex imaging is both visually and qualitatively powerful—once a slide is stained, the human eye can immediately detect the spatial patterns that arise from different biological states. Just think about the last time you saw an immune-excluded tumor: With the right combination of markers, the separation between infiltrating lymphocytes and the tumor wall was likely unmistakable. In fact, some of these spatial landscapes are striking enough to land on a journal cover or hang in a museum.
However, spatial biology research today demands more than qualitative visual descriptions; it requires robust quantitative data. For researchers new to the field, this can be a major hurdle—and even a roadblock to starting a spatial proteomics project at all. Many labs assume that successful quantitative multiplex IHC (mIHC) means buying a new, closed system, re-learning everything, and committing months to panel development.
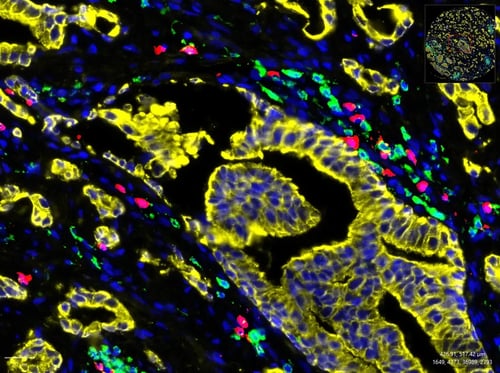
Figure 1. Immune exclusion shown in SignalStar® multiplex immunohistochemical analysis of paraffin-embedded human prostate adenocarcinoma using CD4 (MSVA-004R) & CO-0071-488 SignalStar® Oligo-Antibody Pair #62372 (green), Pan-Keratin (C11) & CO-0003-594 SignalStar® Oligo-Antibody Pair #32962 (yellow), CD8a (D8A8Y) & CO-0004-647 SignalStar® Oligo-Antibody Pair #45683 (red), and ProLong Gold Antifade Reagent with DAPI #8961 (blue). Staining was performed on the BOND RX autostainer by Leica Biosystems.
In reality, you’re likely closer to a successful spatial biology experiment than you think. If you have a mid‑plex use case and a BOND RX Automated Stainer by Leica Biosystems, an ONCORE PRO X System by Biocare Medical or a similar research stainer, you can get actionable mIHC data much faster by building on the infrastructure and antibody portfolio you already trust.
That’s exactly where the SignalStar® Multiplex IHC assay fits in. It combines mid‑plex, oligo‑based staining on FFPE tissue with workflows designed to plug into widely used—and often open‑source—image processing and analysis tools like QuPath, so you can move from qualitative images to quantitative, spatially resolved proteomics data without having to adopt a new, closed system.
Turning Images into Data: Using QuPath with SignalStar mIHC
For many labs, the biggest barrier to quantitative spatial biology isn’t staining—it’s analysis. You might have gorgeous multiplex images, but turning those into cell‑level measurements and spatial relationships can feel like a completely different discipline.
One practical way to bridge that gap is to use an open, well‑supported analysis tool that many digital pathology groups already rely on: QuPath.
QuPath is a powerful, free, open‑source image analysis platform developed by Dr. Pete Bankhead and colleagues at the University of Edinburgh, with the original publication cited over 7,000 times.1 It is widely adopted in the digital pathology community and is supported by active development, extensive documentation, and a large user base that regularly shares scripts, extensions, and tutorials. Because QuPath runs on Mac, Windows, and Linux, it can be deployed on standard lab computers rather than dedicated analysis hardware, making it easier to integrate into existing workflows.
So, how does this help with your SignalStar mIHC panel?
Step 1: Co‑Registering SignalStar Imaging Days 1 & 2
The SignalStar Multiplex IHC assay uses two imaging days to capture up to 8 markers plus DAPI in FFPE tissue. To fully realize the power of that multiplex design, you need a way to bring those images together into a single, aligned dataset.
Using QuPath, you can co‑register your day 1 and day 2 images and generate a single, overlaid image that consolidates all channels. The bioinformatics team at CST has created a step‑by‑step SignalStar–QuPath protocol that walks through this process, so you don’t need an expensive image‑processing platform or specialized computing infrastructure just to merge your SignalStar images.
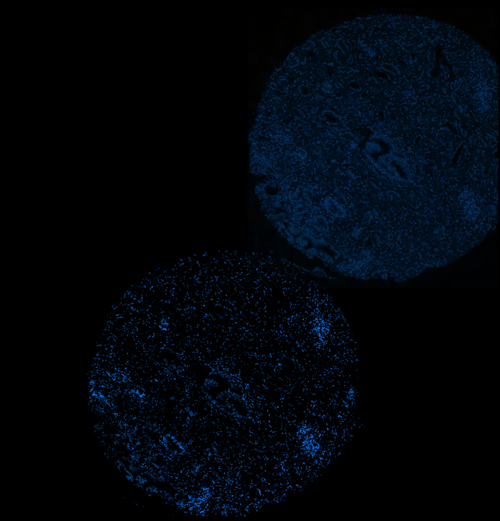 Figure 2: Comparison of Day 1 and Day 2 imaging cycles before (right) and after (left) alignment using the SignalStar-QuPath protocol. The Interactive Image Alignment extension corrects for spatial shifts and small staining shifts by registering the DAPI channels. This workflow preserves all underlying marker data, allowing for seamless multi-cycle visualization and quantification.
Co‑registering your SignalStar images is what makes true cell‑level spatial analysis possible. In spatial biology—especially when you’re looking for rare expression patterns and phenotypes—you need to understand what’s happening at the single‑cell level and in each cell’s immediate neighborhood. A co‑registered SignalStar image produces a single interpretable file with up to 8 markers plus DAPI, so each cell can be analyzed with its complete multiplex profile for more detailed phenotyping and discovery.
Step 2: Using QuPath for Cell Detection & Segmentation
The next step is cell segmentation: Computationally defining which pixels belong to which cells so you can assign fluorescence intensities and spatial features to individual objects rather than broad regions.
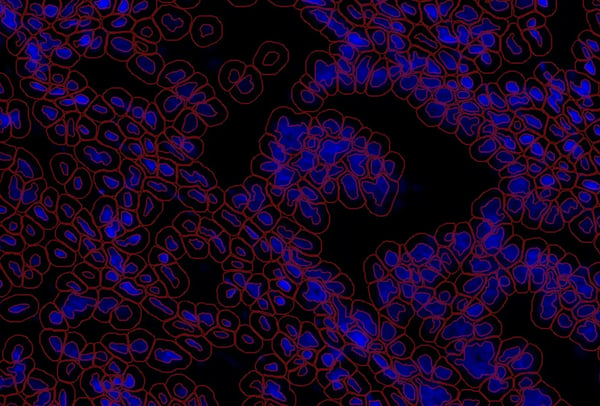 Figure 3. Cell Segmentation of Prostate Adenocarcinoma. Representative image of cell segmentation performed on a prostate adenocarcinoma sample using QuPath (Cell Detection algorithm). DAPI (blue) was used for nuclear staining and segmentation.
Conceptually, segmentation can sound intimidating, but QuPath makes it more approachable, and it’s a necessary step to get accurate spatial biology data out of your panel.2 Within the same interface, you can:
-
Apply built‑in nucleus and cell segmentation tools.
-
Incorporate popular deep learning models such as StarDist or Cellpose.
-
Manually refine boundaries in challenging regions if needed.
Returning to the immune‑excluded tumor example, segmentation takes you from “I can see that immune cells are excluded” to “I can measure how far each immune cell sits from the tumor boundary and how that distance correlates with its phenotype.”
Step 3: Exporting Cell‑Level Data for Spatial Biology Analysis
Once cells are segmented and marker intensities are assigned, QuPath lets you export your SignalStar data as a CSV file, where each row corresponds to a cell and each column holds a measured feature—fluorescence intensity per marker, x/y position, classification, and more.
From there, the file can be imported into statistical environments like R, Python, or other tools your team already uses. With that table in hand, you can begin to answer the types of spatial questions that motivated you to multiplex in the first place, including:
-
Unsupervised clustering of cells based on marker expression.
- Neighborhood and nearest‑neighbor analysis to characterize cell–cell interactions.
- Compartmental analysis across tumor, stroma, and immune microenvironments.
- Dimensionality reduction (for example, UMAP) to visualize phenotypic diversity.
Continuing with the immune‑exclusion example, you could isolate cells at the tumor boundary, perform deep phenotyping on those subsets, and determine whether they exhibit unique signatures compared to more distant immune cells.
Putting It Together: Lowering the Barrier to Quantitative mIHC
In conversations with peers, two concerns come up repeatedly when it comes to adopting multiplex IHC:
- They don’t have access to a flexible, reproducible mIHC assay that allows them to swap markers in and out as their biology evolves.
- They don’t have the time, expertise, or budget to build a custom image processing pipeline or license enterprise‑grade software just to analyze their data.
The SignalStar assay is designed to address the first concern by providing a mid‑plex, oligo‑based assay that runs on common autostainers and is built on CST’s IHC‑validated antibodies. QuPath helps address the second by offering a robust, open‑source analysis environment for co‑registration, segmentation, and cell‑level export.
Together, they create a practical path from “visually striking multiplex images” to quantitative spatial proteomics—one that builds on tools and infrastructure many labs already have, rather than requiring you to start over.
Learn more about SignalStar Multiplex IHC.