


In the past decade, collaboration between the imaging community and biopharma discovery teams has led to methodologies and workflows that increase the capability, throughput, and automation of cellular imaging and analysis pipelines. Unlike hypothesis-driven approaches or conventional screening assays focused on narrow research questions and a few molecular targets, morphological profiling explores broader biological questions through unbiased imaging analysis. Such approaches can maximize the efficiency of imaging pipelines and broaden the horizon for discovery beyond previously known or suspected biological associations.
Cell Painting for Unbiased Morphological Profiling at Scale
Cell Painting is a high-throughput imaging assay developed by the Carpenter-Singh Lab and collaborators to expand the number of cellular features and quantitative data analyzed in a given experiment.1 It uses a multiplex panel of six fluorescent dyes to label organelles and cellular compartments, capturing a wide range of phenotypic signatures from experimental perturbations in multi-well plates.
Following multiplex imaging, the open-source software CellProfiler2 performs machine-based imaging cytometry to extract over a thousand morphological features and phenotypic signatures that collectively form the phenotypic profile of the cells in that sample, which can be compared to other profiles. Among other advantages, Cell Painting does not require aggregating cell populations, so the analysis can be performed at the single-cell level. Furthermore, morphometric readouts can flag “interesting” or “novel” phenotypic profiles, and can be used for clustering compounds and inferring mechanism of action (MoA) by similarity.
As powerful as this is, the software unfortunately won’t go deeper into the biology and tell you which protein targets in which pathways are driving a given phenotype. If, for example, your Cell Painting data shows a phenotypic signature associated with mitochondrial swelling in response to a subset of the compounds you’re testing, the question now is: Which stress or cell death pathways are actually being turned on?
To start translating phenotypic observations into mechanistic understanding, Cell Painting (or another phenotypic screen) needs to be paired with a follow-up workflow to validate targets and deconvolute possible MoA’s. The conclusions of these studies can then be used to inform design of subsequent experiments to solidify target validation and de-risk downstream target selection.
Best Practices for Designing a Follow-Up Multiplex Assay
The subcellular compartments labeled by the six Cell Painting dyes are:
-
Nucleus
-
Nucleoli/cytoplasmic RNA
-
Endoplasmic reticulum
-
F-actin/Golgi/plasma membrane (together in one emission channel)
-
Mitochondria
As a user of Cell Painting, you (or your collaborators) will already have the instrumentation to handle multiplex high-throughput analysis. So it’s natural to design follow-up high-content screens (HCS) that can use the same or similar instrumentation by swapping out some of the cellular dyes for antibodies that are validated for direct or indirect immunofluorescence / immunocytochemistry.
When pursuing possible signaling activities and cellular processes that might be indicated by phenotyping analyses, consider the CST antibodies in the table below as starting points. These targets can help mechanistically link an observed phenotype with the underlying biological process.
| Phenotype & Primary Biological Processes | Upstream Trigger | CST High Content Screening Antibodies |
| Mitochondrial Fragmentation Mitophagy, Early Apoptosis, Metabolic shift |
Drp1 fission activation or Mitophagy induction | • Phospho-DRP1 (Ser616) |
| ER Stress & Vacuolation Integrated Stress Response, Paraptosis |
Unfolded Protein Response (UPR) activation | • ATF4 • CHOP • XPP-1s |
| Golgi Dispersal Secretory blockade, Mitotic entry |
Microtubule depolymerization or Mitotic entry | • Acetylated α -Tubulin • Cyclin B1 • Golgin-97 |
| Actin Stress Fibers Mechanotransduction, Senescence |
RhoA-GTPase activation | • Phospho-MLC (Thr18/Ser19) |
| Fragmented Cytoskeleton Cytoskeletal catastrophe, Mitotic collapse |
Depolymerization of tubulin/actin | • Phospho-Stathmin (Ser38) • Phospho-Cofilin (Ser3) |
| Cell Spreading / Rounding Cell migration, Mitosis entry, Anoikis |
Focal adhesion turnover or mitotic rounding | • Phospho-Paxillin (Tyr118) • Phospho-Histone H3 (Ser10) |
| Membrane Blebbing Apoptosis (execution phase), Necroptosis |
Caspase-mediated ROCK1 activation or Necroptosis | • Cleaved Caspase-3 (Asp175) • Phospho-RIP3 (Ser227) |
| Nuclear Fragmentation Mitotic catastrophe, Late apoptosis, Genomic instability |
DNA double-strand breaks (DSBs) | • γ-H2A.X (Ser139) • Phospho-53BP1 (Ser1778) |
| Nuclear Condensation Pyknosis (Apoptosis), Heterochromatinization |
Apoptotic execution or chromatin silencing | • Cleaved PARP1 (Asp214) • H3K9me3 |
| Lysosomal Hypertrophy Autophagic flux block, Lysosomal storage |
Autophagic flux block | • p62 (SQSTM1) • Phospho-mTOR (Ser2448) • LC3 |
| Lipid Droplet Accumulation Lipophagy inhibition, Cancer metabolic rewiring |
Lipophagy block or metabolic rewiring | • Perilipin-1 • Perlipin-2 |
Some dyes used in Cell Painting can also be employed for segmentation in antibody-based analyses. Consider tying your Cell Painting dataset to your follow-up screen by carrying through a nuclear marker (Hoescht or DAPI), and a membrane marker (Wheat Germ Agglutinin).
To reveal the underlying biology, ask: What 2–3 protein markers would tell the story of the signaling activities you suspect are involved?
Starting with a focused multiplex antibody panel linked to a phenotype “family” can be a useful strategy to inform your next step. To avoid the wasted time and extra cost that come from pursuing faulty hypotheses exacerbated by spurious data, select antibodies and antibody conjugates with appropriate application validation. All CST antibodies validated in IF‑IC work in high-content imaging (HCI) and in high-throughput image-based cell analysis screens that follow your initial Cell Painting assays, so you can have confidence your panel is correctly and specifically reporting the desired targets.
What can I learn from antibody-based high-content assays after Cell Painting?
With your antibody panel built, you’re ready to move from the initial morphological screen and start exploring the mechanisms driving those phenotypes. Antibody-based high-content assays let you maintain the same morphology-driven, multiplex imaging approach while adding protein-level readouts that help explain why a given phenotype is changing and which pathways are involved.
|
Virginia Bain, PhD |
“Cell Painting shows you where to look by helping to reveal the phenotypes where the biology gets interesting. Then, antibody-based high-content imaging can help you work out what’s actually changing mechanistically inside the cell.” |
%20Bain%2c%20PhD%20CST%20Immunofluorescence.png?width=169&height=169&name=Virginia%20(Ginny)%20Bain%2c%20PhD%20CST%20Immunofluorescence.png)
To illustrate what this type of data looks like in action, the following three examples from CST Immunofluorescence Group Leader Virginia Bain, PhD, highlight how targeted antibody panels can be used to interrogate narrower biological mechanisms while maintaining a morphology-based imaging approach.
"Diseases like Alzheimer’s and Parkinson’s have a huge impact on society," says Dr Bain. "To provide scientists with the validated tools needed to accelerate discovery, we teamed up with FujiFilm to use CST antibodies in high-content analysis to better characterize iPSCs that might be used to study these diseases."
Taken from CST posters in neurodegeneration and neuroinflammation presented at recent scientific conferences, the following examples demonstrate how this strategy can be applied to dissect lysosomal function, mitochondrial dynamics, and microglial activation.
"Many of the readouts we looked at in these posters were organelle-based, and are great examples of the follow-up work you might do after a Cell Painting screen," explains Dr Bain.
Download the posters linked below for access to the full datasets.
LAMP-1 Puncta Mark Lysosomes in a Parkinson’s Disease Model
Lysosomal dysfunction is a driver of Parkinson’s Disease. Leucine-rich repeat kinase 2 (LRRK2) has at least 20 mutations associated with Parkinson's, and LRRK2 mutations have been shown to impact the autophagic-lysosomal pathway (ALP) and lead to PD-associated protein aggregation and accumulation. To assess ALP function in normal and LRRK2-mutated iPSC-derived dopaminergic neurons, we designed imaging experiments using panels that included LAMP1, Cathepsin B (CTSB), and LC3A/B as markers. Lysosomes are punctate (0.2–1.2 μm) in morphology, making them amenable to quantitative analysis of their intensity, spots per cell or neuron, and the area of the spots. Our quantitative analysis in the CellProfiler software showed an increase in LAMP1-positive spots in LRRK2-mutated iPSCs, without a corresponding increase of CTSB in the same cells, supporting ALP dysfunction as a potential mechanism of action in this model.
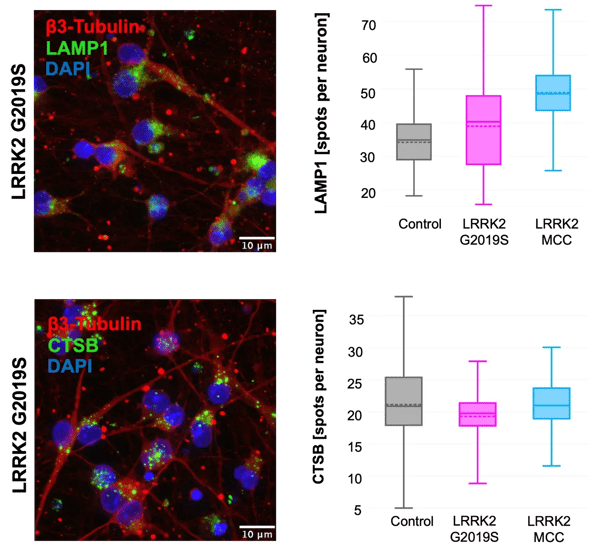 Lysosomal proteins LAMP1 and Cathepsin B (CTSB) were imaged in healthy control iCell DopaNeurons, neurons harboring a LRRK2 G2019S mutation, as well as LRRK2 mutation-corrected control (MCC) neurons (left) using LAMP1 (D2D11) Rabbit Monoclonal Antibody #9091 and Cathepsin B (D1C7Y) Rabbit Monoclonal Antibody #31718. The images were quantified for spots per neuron (right).
Mitochondrial Fission and Fusion Dynamics in Parkinson's Disease Models
Mitochondrial dysfunction is also a driver of PD. In normal cells, mitochondria undergo continuous fusion and fission, which supports membrane potential and mitochondrial health through the exchange of intramitochondrial components and mtDNA, and helps eliminate dysfunctional mitochondria. High rates of fission lead to blebbing and fragmentation of mitochondria, while higher rates of fusion result in mitochondrial branching. Mitochondria can be labeled either with an antibody against a mitochondria-localized protein, such as COX IV, or with a fixable mitochondrial stain such as MitoTracker Red CMXRos, which must be applied to live cells before fixation. Fission and fusion can then be assessed in CellProfiler by measuring the number of mitochondria per cell, as well as the number of branches and branch junctions per mitochondrion. Our quantitative analyses of mitochondria staining by COX IV are indicative of low mitochondrial fusion in both the healthy control and LRRK2 G2019S neurons.
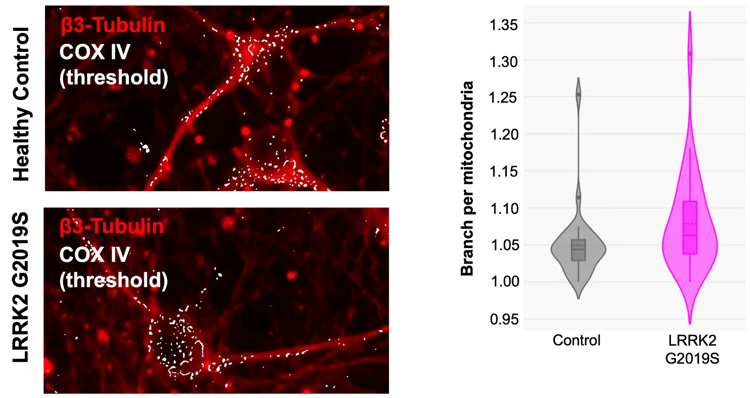 Mitochondria morphology assessment in iPSC-derived neurons. Healthy control or LRRK G2019S iCell DopaNeurons were stained with COX IV (3E11) Rabbit Monoclonal Antibody #4850, and a threshold was applied to visualize mitochondrial networks (left). The thresholded images were quantified for branches per mitochondria (right).
NF-κB Translocation Indicates Inflammatory Signaling in TREM2 Mutant Microglia
The Triggering Receptor Expressed on Myeloid Cells 2 (TREM2) protein is expressed in microglia, the resident macrophages of the brain that are involved in neuroinflammatory events. TREM2 became the subject of intense research interest due to the association of the R47H mutation in late-onset Alzheimer’s Disease (AD). To evaluate the inflammatory capacity of microglia with altered TREM2 function, we measured nuclear translocation of NF-κB in microglia with a functional knockout of TREM2 and then stimulated by LPS or IFN-γ / TNFα treatments. With a stimulus, NF-κB translocates from the cytoplasm (where it is inactive) to the nucleus to drive gene transcription. Both the number of cells with nuclear NF-κB and the intensity of the nuclear signal can provide informative readouts. In these experiments, we observe that even in the absence of TREM2, microglia are still able to respond to inflammatory stimuli. In fact, the response in the absence of TREM2 is more robust (both in frequency and in the intensity of nuclear signal) than what we observe in apparently healthy normal microglia. Parsing the frequency of responding cells and the magnitude of their individual responses across multiple treatments can help to identify the specific stage of microglial dysregulation in AD models.
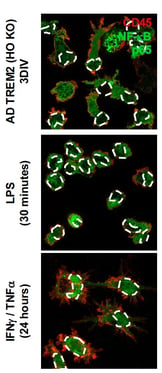
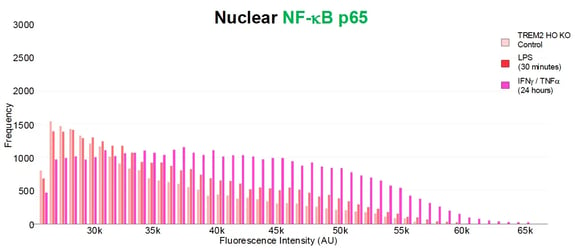
iCell microglia and engineered TREM2 Homozygous Knockout (HO KO) microglia were treated with LPS or cytokines to assess how lack of TREM2 impacts NF-κB (left), identified using NF-kappaB p65 (D14E12) Rabbit Monoclonal Antibody #8242. The images were gated on positive nuclear signal and quantified (right).
View the poster: Characterization of iPSC-derived human microglial activation using high-content immunofluorescence
Advancing from Cell Painting to Mechanistic Insights
Cell Painting and similar unbiased imaging assays enable screening groups and research teams to “measure everything, ask questions later”.3 Even though we now live in the era of big data and AI-driven screening, when it comes time to actually ask the questions, you’ll still need trustworthy reagents for your next assays, including IF-IC-validated antibodies to move forward.
Once you start getting real answers in your post-Cell Painting studies, you will be able to further hone in on the MoA and focus your discovery pursuits to the next stage of the pipeline.
References
-
Bray MA, Singh S, Han H, et al. Cell Painting, a high-content image-based assay for morphological profiling using multiplexed fluorescent dyes. Nat Protoc. 2016;11(9):1757-1774. doi:10.1038/nprot.2016.105
-
Carpenter AE, Jones TR, Lamprecht MR, et al. CellProfiler: image analysis software for identifying and quantifying cell phenotypes. Genome Biol. 2006;7(10):R100. doi:10.1186/gb-2006-7-10-r100
-
CellProfilerTeam. Looking for the unexpected: unbiased image analysis. Image.sc Forum. Published Dec 7 2016.
26-DDC-65600