You load your Bioanalyzer, hold your breath, and watch the trace appear. Instead of a clean peak, you see… almost nothing. No distinct library peak, no comforting curve—just a faint smear that looks like failure. Meanwhile, your sequencing budget is tight, samples are precious, and the clock on your project is still ticking.
This is the moment every epigenetics researcher dreads: Is the library truly a bust, or could it still deliver high-quality NGS data despite the low or invisible signal? In this post, we explain why “too low to detect” does not necessarily mean “too poor to sequence,” and how to make confident, data-driven decisions about when to move forward and when to go back to the bench.
Chromatin profiling methods, such as Chromatin immunoprecipitation (ChIP) and next-generation sequencing, have transformed how researchers study protein–DNA interactions. Techniques like ChIP-Seq have quickly become the standard for generating genome-wide binding maps. Newer approaches such as CUT&RUN and CUT&Tag were developed to address key pain points with traditional ChIP workflows, including input requirements, background signal, and hands-on time.
If you have already made the shift to CUT&Tag, you are probably doing it to gain higher sensitivity from fewer cells and cleaner signal from your target of interest—which makes a “low-yield” Bioanalyzer trace especially frustrating. Once your libraries are prepared, you face a critical decision point: How to interpret NanoDrop or Qubit measurements alongside Bioanalyzer or TapeStation traces and decide whether your CUT&Tag DNA library is still worth sequencing.
Not All Methods Are Equal: Your Library Yield Depends on How You Measure
Together, ChIP-Seq, CUT&RUN, and now CUT&Tag all rely on accurate DNA quantification before NGS; however, different methods can yield very different results for the same library.
Bioanalyzer or TapeStation instruments are often used to establish DNA and RNA sample quality control. Before analysis, the library concentration can be determined using the Thermo Fischer Scientific Nanodrop instrument, Qiagen QIAxpert system, Thermo Fisher Scientific Qubit Fluorometric Quantification system, or PicoGreen assay. However, the measured yield of the amplified CUT&Tag DNA library can vary based on the method used.
Below, CST scientists compare NanoDrop, Qubit, and PicoGreen measurements for the same amplified CUT&Tag DNA library and provide practical yield guidelines—along with why you can still obtain high-quality NGS data even when those values look low.
| Method | Target | Expected Concentration | Recommendations |
| NanoDrop or QIAxpert System | Histone | 10–20 ng/µL | If your DNA library concentration is >3 ng/µL, we recommend moving forward with NGS analysis even if the library QC signal on BioAnalyzer or TapeStation system is weak or invisible. Refer to the CST Troubleshooting guide if the library concentration is <3 ng/µL. |
| Co-Factor or Transcription Factor |
5–12 ng/µL | ||
| Qubit Fluorometric Quantification System or PicoGreen Assay | Histone | 3–10 ng/µL | Concentrations may be too low to run on the BioAnalyzer or TapeStation system. We recommend that you still analyze the library with NGS if your positive control, like Tri-Methyl-Histone H3 (Lys4), generates the expected library yield and/or Bioanalyzer or TapeStation peaks, or qPCR QC on the CUT&Tag DNA library generates a good signal-to-noise ratio. |
| Co-Factor or Transcription Factor |
<1 ng/µL |
Low or even undetectable Bioanalyzer signal does not automatically mean your CUT&Tag library will fail in sequencing, especially when more sensitive quantitation methods and controls support moving forward.
Refer to the CUT&Tag FAQ page to view supporting data and/or for guidance on pooling samples with different yields together.
How to QC DNA Libraries Before Sequencing
The Bioanalyzer or TapeStation system gives you information on the sample concentration, average fragment size range, and sample purity. When the target of interest, such as a transcription factor, is not abundant in a cell or when only a small number of cells are available, these profiles can suggest low library yields, making it hard to know whether to move forward with NGS.
Many researchers using ChIP-Seq or CUT&RUN libraries might choose not to proceed in this scenario, but baseline thresholds are lower using CUT&Tag—which raises an important question: Can you still successfully sequence your CUT&Tag DNA library even if the Bioanalyzer or TapeStation signal is low?
CUT&Tag Can Deliver Quality NGS Data Even When Bioanalyzer or TapeStation Signal Is Low
When working with a low-abundance target or a small number of cells, we suggest running a positive control like Tri-Methyl-Histone H3 (Lys4) along with your DNA library to evaluate protocol success.1 If the positive control signal is high but the target library signal is low, the CUT&Tag DNA library can still be successfully sequenced to provide important protein-DNA interaction data (Figure 1).
Therefore, we recommend sequencing your CUT&Tag DNA library even if you see very weak or even no visible peaks in the profile from the Bioanalyzer or TapeStation system.
Robust TCF4/TCF7L2 Sequencing Results Despite Low Signal on a High Sensitivity Bioanalyzer Chip
.jpg?width=780&height=177&name=23-ETC-03854%20CUT%26Tag%20Bioanalyzer_Blog%20Image1%20(1).jpg)
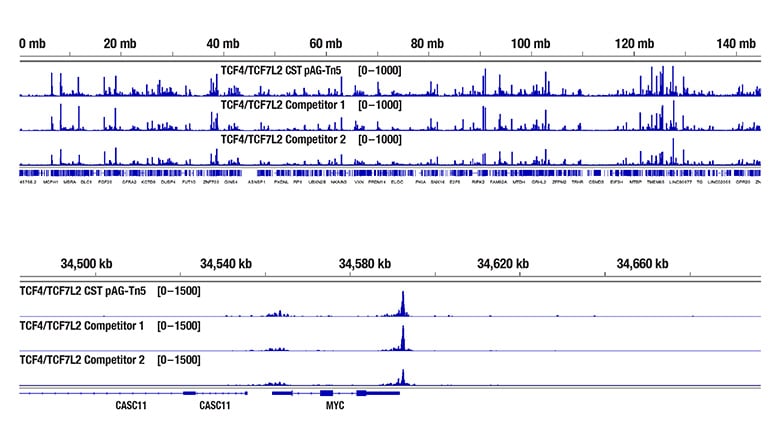
Figure 1. CUT&Tag was performed with HCT 116 cells and TCF4/TCF7L2 (C48H11) Rabbit mAb #2569, with several sources of loaded pAG-Tn5. The amount of each enzyme used was based on the manufacturer’s recommendation. DNA libraries were prepared using the CUT&Tag Dual Index Primers and PCR Master Mix for Illumina #47415. The figure (upper image) shows the profiles from a High Sensitivity DNA chip run on the Bioanalyzer system for the three CUT&Tag DNA libraries.
The same DNA libraries analyzed with the High Sensitivity DNA chip on the Bioanalyzer system were sequenced, and the resulting NGS tracks are shown (lower image). NGS data shows equivalent binding across chromosome 8 (upper), including MYC (lower), a known target gene of TCF4/TCF7L2.
qPCR: An Alternative QC Method for Your CUT&Tag DNA Library
If you still have concerns about sequencing your CUT&Tag DNA library with a low signal result from the Bioanalyzer or TapeStation system, another option is to perform qPCR on the DNA library against known positive and negative loci to assess the enrichment of chromatin fragments as a QC step before NGS.
It is important to note that the qPCR should be performed on the CUT&Tag DNA library and not on the CUT&Tag DNA prior to library preparation. CUT&Tag DNA is not compatible with qPCR analysis prior to library amplification because both tagmented small DNA and large DNA are present in the sample as a result of the nuclear membrane being broken open at the end of the CUT&Tag assay. The tagmented DNA is selectively enriched during DNA library PCR amplification, which effectively dilutes out the genomic DNA and makes the CUT&Tag DNA library amenable to qPCR analysis. Generating a good signal-to-noise ratio with qPCR is a strong indicator that you will also be able to successfully sequence your CUT&Tag DNA library.
CUT&Tag DNA Library Generates qPCR Data with Much Higher Signal-to-Noise Ratios
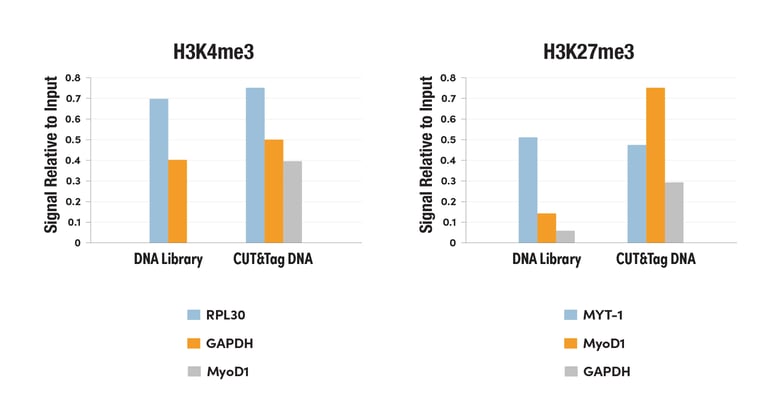
Figure 2. CUT&Tag was performed with HeLa cells and Tri-Methyl-Histone H3 (Lys4) (C42D8) Rabbit mAb #9751, using CUT&Tag Assay Kit #77552. DNA libraries were prepared using CUT&Tag Dual Index Primers and PCR Master Mix for Illumina Systems #47415. The enriched DNA was quantified by real-time PCR using positive primer sets against the known binding sites of H3K4me3, SimpleChIP® Human RPL30 Exon 3 Primers #7014 and human GAPDH exon 1 primers Exon 1 Primers, and the negative primer set against a known negative site of H3K4me3, SimpleChIP Human MyoD1 Exon 1 Primers #4490. The amount of immunoprecipitated DNA in each sample is represented as signal relative to the total amount of input chromatin, which is equivalent to one.
The Bottom Line
We find that the High Sensitivity ScreenTape Assay, rather than the Standard ScreenTape Assay, on the TapeStation system provides a better method for CUT&Tag library quality assessment due to its optimized fluorescent chemistry and reduced baseline noise.
Bottom line—don't let low signal from a Bioanalyzer or TapeStation system stop you from sequencing your CUT&Tag Library DNA. You will likely be missing out on high-quality results if you do!
Reference
-
Kaya-Okur HS, Wu SJ, Codomo CA, et al. CUT&Tag for efficient epigenomic profiling of small samples and single cells. Nat Commun. 2019;10(1):1930. Published 2019 Apr 29. doi:10.1038/s41467-019-09982-5
23-ETC-03854